By Niti Pawar, MD, and Odmara Barreto Chang, MD, PhD
History of Neuromonitoring
The use of intraoperative electroencephalogram (EEG) dates back to 1937 when Dr. Gibbs and colleagues demonstrated that there were clinical and electroencephalogram (EEG) changes with increasing anesthetic doses, noting that “a practical application of these observations might be the use of EEG as a measure of the depth of anesthesia.”1,2 While other early research demonstrated the utility of EEG monitoring in anesthesia, it was in the 1990s that “depth-of-anesthesia”, as it was initially called, gained popularity as a way to intraoperatively assess brain activity using noninvasive frontal EEG.3
Monitoring the brain intraoperatively is crucial, as it is the main target of our anesthetics. Older adults are more sensitive to the effects of gas and intravenous anesthetic agents and need significantly lower doses to reach adequate levels of general anesthesia.4,5 For example, excessive sevoflurane and propofol levels have been associated with postoperative delirium (POD) in older adults.6,7 As we understand how anesthetics influence the brain and learn about EEG patterns, it is noticeable how the increased interest and advances in EEG monitoring in the last decade have allowed for its routine use in the operating room. Furthermore, in 2018, the World Health Organization World Federation of Societies of Anesthesiologists International Standards for a Safe Practice of Anesthesia formally suggested the use of EEG to measure brain function during general anesthesia, especially in patients at risk of postoperative delirium (POD).8
What information is captured in the EEG monitor?

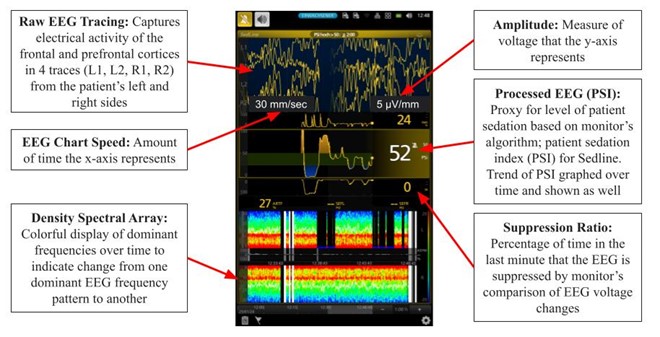
Figure 1. Frontal EEG monitor example (SedLine). A frontal noninvasive sticker is placed on patient’s forehead, and data from intraoperative EEG recording is displayed.
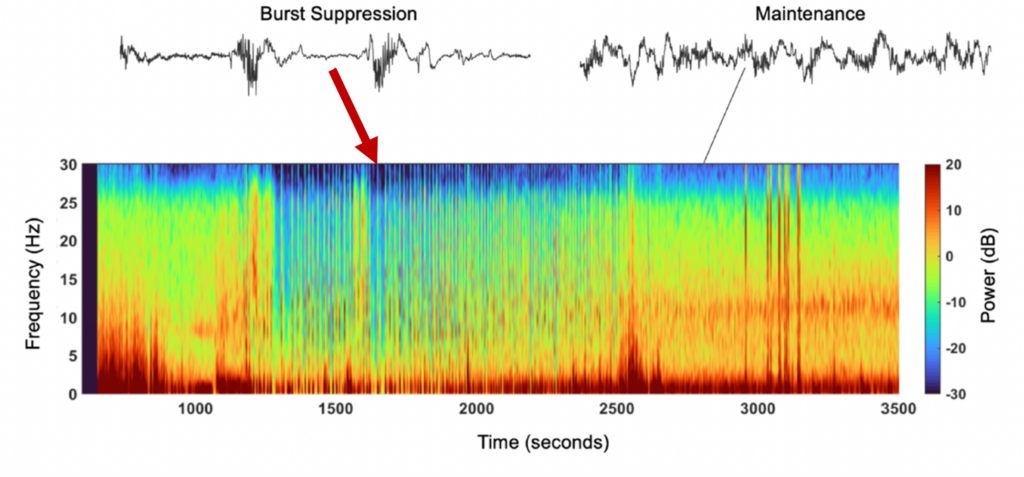
At first, the EEG monitor can look complex, as there are many data points and parameters displayed in the screen (Figure 1). Both raw EEG or processed EEG such as patient stated index (PSI) or bispectral index (BIS) are currently used to guide anesthetics intraoperatively. Monitor processed indices such as PSI are averages over a timeframe of data and are therefore calculated with a time-lag; changes are not immediately represented. During general anesthesia it is recommended to maintain ranges 40-60 for BIS and 25-50 for PSI.9-11 This range is suggested to avoid a pattern called burst suppression (BS). BS consists of alternating episodes of isoelectric flat EEG periods and high voltage bursts of waves.6 Burst suppression has been identified in hypothermia, coma, early infantile epileptic encephalopathy, and in general anesthesia.6 Currently evidence shows that burst suppression is associated with poor patient outcomes such as POD.12 BS can be detected visually in the raw EEG tracing of the monitor by alternating periods of high activity and flatline, or a density spectral array with areas of blue/green indicating lower power, compared to red/orange indicating higher power (Figure 2). Another tool the monitor provides is the burst suppression ratio (BSR) or suppression rate (SR) as values > 0 as indicators of BS; this ratio provides the percentage of time in the last minute that the EEG is suppressed by the monitor’s comparison of EEG voltage changes. Figure 2. Spectrogram and EEG raw traces. Suppression episodes during burst suppression in the spectrogram show as periods of blue, vertical lines.

Adjusting your parameters
The information provided by noninvasive frontal EEG monitors is helpful for titrating anesthesia such that it is not too much or too little based on the patient’s neurological status. If burst suppression is visible on the monitor, it is an indication to lower the amount of anesthetic, regardless of the PSI or BIS. If the PSI or BIS is low, it increases the likelihood that the patient is in burst suppression and prompts further assessment of the clinical picture, including looking at the raw tracing, BSR or SR, and density spectral array (DSA), to determine if the patient is overly sedated. Note that it is still possible for the patient to be in burst suppression as per raw tracing and BSR or SR, even if the PSI or BIS is normal, due to artifact and various other factors.
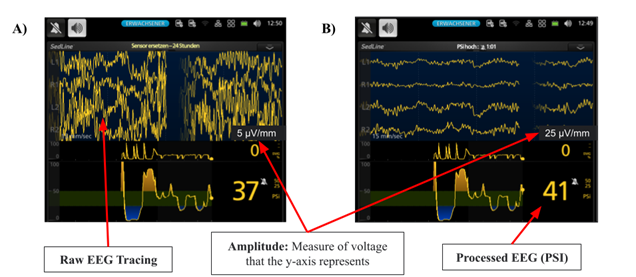
If the visual burst suppression is not aligning with the other factors, another crucial thing to consider is whether the settings are misrepresenting the patient’s neurological status––particularly EEG amplitude. Not knowing how parameter settings change the visual appearance of EEG can cause confusion. If the amplitude is set too high, then the raw tracings appear to flatten and can be confused for burst suppression (Figure 3B). This portrays how changes due to settings can be misleading for the reader if the amplitude is not factored in when analyzing the raw EEG tracings. Note that changing the settings does not change the PSI or BIS, only the visual appearance of raw tracings.

Future Directions
EEG monitors are becoming more common in operating rooms; we can expect increased use during anesthesia. Despite the tremendous potential value they bring to perioperative care, various issues limit their use. EEG training is not part of the standard curriculum of residency training. The lack of training is a gap, as providers all have different levels of understanding of how to use the monitors and which measures to look at.
We presented examples of how visual analysis of raw EEG tracings can change depending on the monitor settings and how these settings can be adjusted to reflect a picture of the CNS function in real-time. Importantly, raw EEG should be visually analyzed to assess for burst suppression, as often the processed EEG indices (i.e., PSI, BIS) may only provide part of the picture. Educating anesthesia providers about interpreting raw and processed EEG monitor information and common pitfalls would ultimately allow anesthesia providers to become more proficient in interpreting and applying the data obtained from EEG monitors in conjunction with the clinical picture. In the coming years, we will continue learning about the different brain activity patterns under anesthesia using EEG modalities. Understanding how to make changes in anesthetics based on these patterns would allow us to use the information to change clinical care and potentially improve surgical outcomes.
Acknowledgements: The authors thank Matthias Kreuzer, Ph.D. for providing examples of EEG displays with different parameters.
References:
1. Gibbs FA, Gibbs EL, Lennox WG. Effect on the Electro-Encephalogram of Certain Drugs Which Influence Nervous Activity. Archives of Internal Medicine. 1937;60(1):154-166. doi:10.1001/archinte.1937.00180010159012
2. Purdon PL, Sampson A, Pavone KJ, Brown EN. Clinical Electroencephalography for Anesthesiologists: Part I: Background and Basic Signatures. Anesthesiology. Oct 2015;123(4):937-60. doi:10.1097/ALN.0000000000000841
3. Rampil IJ. A primer for EEG signal processing in anesthesia. Anesthesiology. Oct 1998;89(4):980-1002. doi:10.1097/00000542-199810000-00023
4. Jia L, Hou J, Zheng H, et al. Study of the rational dose of propofol in elderly patients under bispectral index monitoring during total intravenous anesthesia: A PRISMA-compliant systematic review. Medicine (Baltimore). Jan 2020;99(5):e19043. doi:10.1097/MD.0000000000019043
5. Mapleson WW. Effect of age on MAC in humans: a meta-analysis. Br J Anaesth. Feb 1996;76(2):179-85. doi:10.1093/bja/76.2.179
6. Pawar N, Barreto Chang OL. Burst Suppression During General Anesthesia and Postoperative Outcomes: Mini Review. Front Syst Neurosci. 2021;15:767489. doi:10.3389/fnsys.2021.767489
7. Cao SJ, Zhang Y, Zhang YX, et al. Delirium in older patients given propofol or sevoflurane anaesthesia for major cancer surgery: a multicentre randomised trial. Br J Anaesth. Aug 2023;131(2):253-265. doi:10.1016/j.bja.2023.04.024
8. Gelb AW, Morriss WW, Johnson W, et al. World Health Organization-World Federation of Societies of Anaesthesiologists (WHO-WFSA) International Standards for a Safe Practice of Anesthesia. Anesth Analg. Jun 2018;126(6):2047-2055. doi:10.1213/ANE.0000000000002927
9. Soehle M, Ellerkmann RK, Grube M, et al. Comparison between bispectral index and patient state index as measures of the electroencephalographic effects of sevoflurane. Anesthesiology. Nov 2008;109(5):799-805. doi:10.1097/ALN.0b013e3181895fd0
10. Medtronic. Bistm Complete Monitoring System Operator’s Manual. Available online at: https://asiapac.medtronic.com/content/dam/covidien/library/global/multi/product/brain-monitoring/BISCompleteMonitor_OperatorsManual_Multi_10103075A00.pdf. Accessed March 27, 2024.
11. Massimo. SedLine Sedation Monitor Operator’s Manual. Available at https://techdocs.masimo.com/contentassets/c19b67c39baa430daf34fb73907d8578/lab-7373e-master.pdf. 2017. Accessed March 27, 2024. https://techdocs.masimo.com/contentassets/c19b67c39baa430daf34fb73907d8578/lab-7373e-master.pdf
12. Jung C, Hinken L, Fischer-Kumbruch M, et al. Intraoperative monitoring parameters and postoperative delirium: Results of a prospective cross-sectional trial. Medicine (Baltimore). Jan 8 2021;100(1):e24160. doi:10.1097/MD.0000000000024160
